
EMR. Clinical data on rare disease is not necessarily rare; it is our ability to unlock already existing data that is rare. Over the last decade, we have tried to understand the fingerprints that rare genetic epilepsies leave in the electronic medical record (EMR). In our flagship publication last year, we tried to push the boundary. Is EMR data, with all its strength and weaknesses, able to predict genetic diagnosis? Here is our journey through the hidden signals in large EMR datasets.
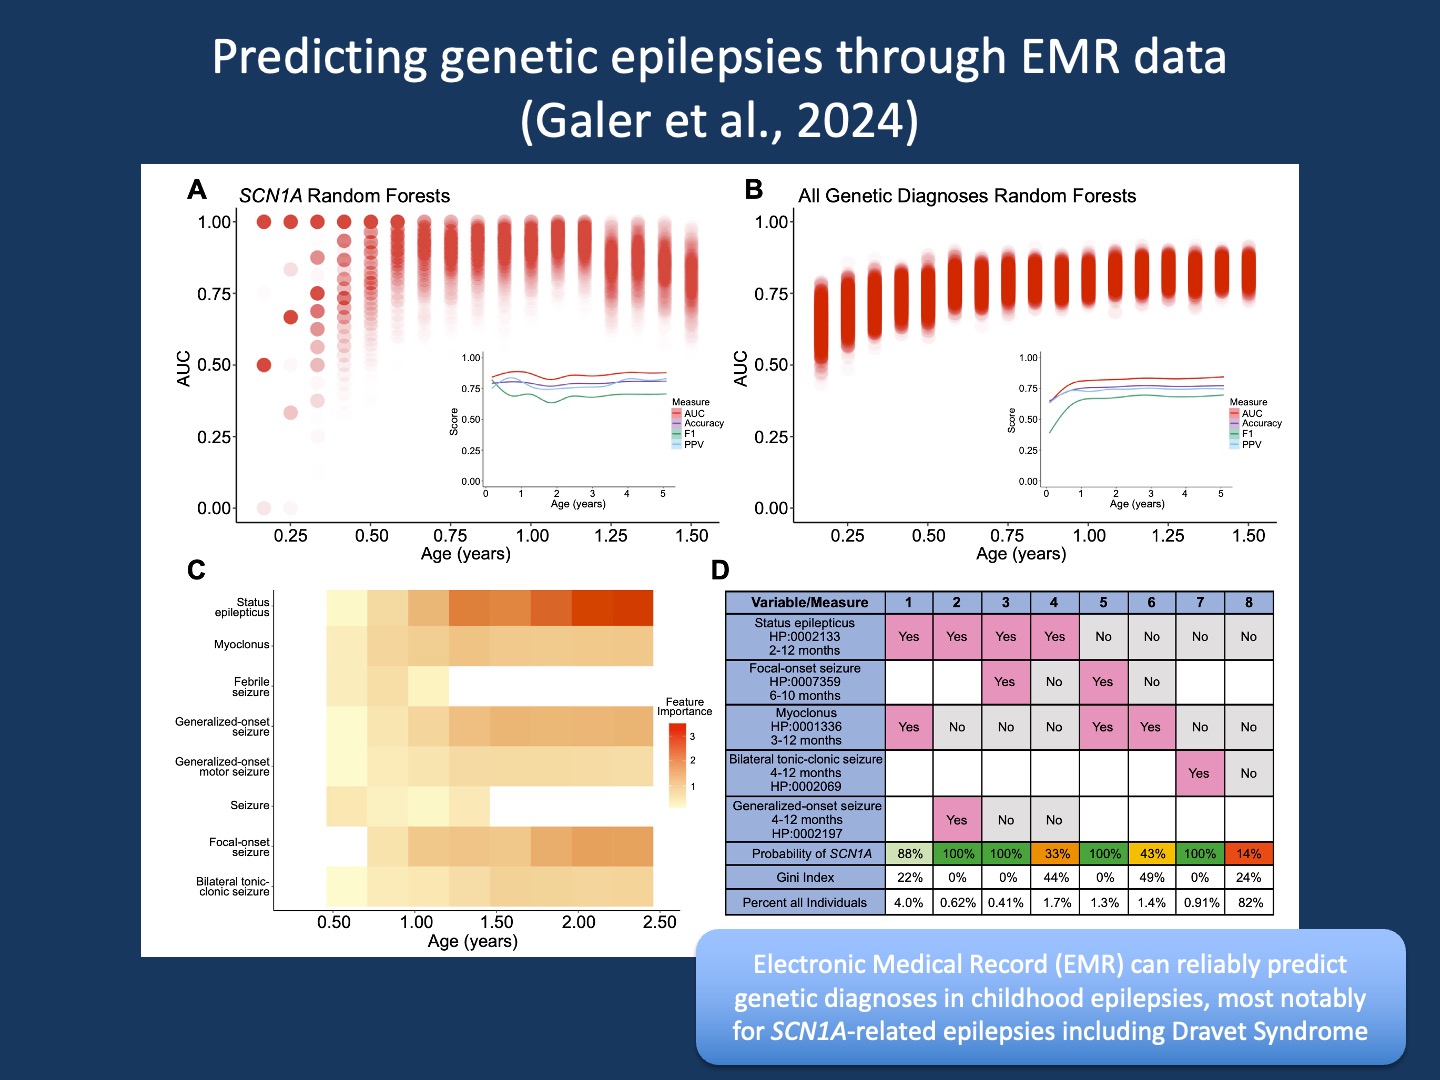
Figure 1. Random forest models predict SCN1A and genetic diagnoses. (A, B) AUCs of 1000 random forest models across time bins predicting SCN1A or any genetic diagnosis. The genetic diagnosis model used principal components explaining 80% of feature variance. Red dots show individual model performance; darker shading indicates more models at that AUC. Insets show AUC, Accuracy, F1, and PPV over age bins with smoothed trend lines. (C) Median importance of 7 features from SCN1A models across age bins (D) Decision tree table predicting SCN1A from 0–1 years using 5 features. Columns show feature presence and/or absence and associated SCN1A probability. Percentages indicate the portion of EGRP and PELHS individuals meeting each scenario before diagnosis (from Galer et al., 2024).
EMR data. Electronic medical records are ubiquitous. Initially built largely for billing purposes, modern EMRs have become comprehensive tool suites that permeate most aspects of patient care. In addition to the clinical use of the EMR, there has been an increased interest in using EMR datasets for research purposes. And when combined with genomic data, we are entering the area of EMR Genomics. Over the last decade, this area of research is where our lab has spent most of its effort. From our very first encounter with EMR data, we have tried to make sense of the longitudinal nature of the data, which is particularly relevant to pediatric conditions, where trajectories often matter more than the presence of clinical features alone.
Time. In our initial work by Ganesan et al, we developed the foundation of how we analyze EMR data in childhood epilepsies. In brief, we use a process called “time binning” to break down disease trajectories into small age bins and assess the presence and/or absence of clinical features in a patient cohort for each time bin separately. Why is this important? First, because the importance of clinical features varies over time. Importance, in this case, can be measured by a concept referred to as Information Content (IC). Take febrile seizures as an example. Febrile seizures typically occur between six months and six years. But when febrile seizures occur beyond six years, this may point towards the rare genetic syndrome Genetic Epilepsy with Febrile Seizures Plus (GEFS+). When using time binning, these seizures would stand out at eight or nine years, as they have a much higher IC. They are much less common than typical febrile seizures and therefore contribute more to any analysis that is based on clinical features. In fact, this rare feature might even be the main contributor that drives a phenotypic analysis. Without time binning, this difference would be lost.
Landscapes. Based on binned EMR data, we proceeded to build phenotypic landscapes and identified specific fingerprints associated with genetic epilepsies. We had previously discovered similar clinical signatures with static phenotypic data, using the limited phenotype information that is typically provided with large genomic studies without any reference to when these features emerged (hence, we refer to this data as “static” as opposed to “longitudinal” data from the EMR). Longitudinal phenotypic fingerprints are intriguing and form the basis of many natural history and clinical trial readiness studies. They remind us that clinical data on rare diseases is not necessarily rare—it is our ability to understand ubiquitously available clinical data that is rare.
Prediction. Building phenotypic landscapes is one thing, but using these harmonized phenotypes to predict genetic diagnosis is something else entirely. We know that there are many gene-phenotype associations in the EMR, but this does not necessarily mean that the existing associations add up to sufficient predictive power. In our study by Galer and collaborators in Genetics in Medicine, we tried to take the next step, learning from our prior work on EEG predictions in neonates. There were two major methodological innovations that we took advantage of emerging from our prior work.
Note elimination. Let’s face it: EMR data is messy. It is also “contaminated” by diagnostic information. Once an individual receives a genetic diagnosis, EMR notes are typically populated with generic information about the underlying disease and alternative diagnosis. This is typically not an issue when you review data manually. However, this becomes an issue when you try to analyze data at scale. In our case, we needed to parse 89 million time-stamped clinical annotations from 4,572,783 clinical notes across 32,112 individuals that we translated to the Human Phenotype Ontology (HPO) using Natural Language Processing (NLP). How can you overcome this issue? In brief, we merged our phenotypic timelines with information about the age of genetic diagnosis and removed every single patient note written after a genetic diagnosis was made. This left us with clinical information that was generated exclusively before the genetic test returned.
Decision trees. There are many ways to analyze data, especially in the era of machine learning and artificial intelligence. However, there are only few ways to analyze datasets such as EMR data that is highly dimensional and sparse. There are thousands of phenotypic categories, but each individual only has a small number of phenotypes. Harmonization using HPO helps generate broader categories but only reduces the underlying problem to a certain extent. Enter decision trees and Random Forest models. In our prior work, we have found that these frameworks (Figure 1D) are capable of handling EMR data better than most other analysis frameworks, and they can generate data that can be easily understood.
Combinations. The overall power to predict an SCN1A diagnosis was the highest amongst the various genetic epilepsies in our study. Various measures of predictive power such as Area Under the Curve (AUC), Accuracy, F1, and Positive Predictive Value (PPV) were well above 75% across the entire age range (Figure 1A). However, how we arrived at these predictions was interesting. There was no single way to predict SCN1A, but instead a combination of many rare predictions. We were able to demonstrate that the presence of status epilepticus and myoclonus in the first year of life is highly predictive of a causative SCN1A variant but only applies to 4% of all individuals who were later diagnosed. Other combinations of features have similar predictive power but are also individually rare. This emphasizes that there is not one single way to predict Dravet Syndrome, but a combination of various scenarios. In brief, to predict genetic epilepsies, we need to appreciate their clinical heterogeneity and that combinations of rare clinical features add up. This is where large data analysis comes in. Given that our study was based on EMR data, it can be implemented in the very systems that generated the data in the first place.
What you need to know. In one of the most data-heavy studies in the genetic epilepsies to date, we were able to examine the clinical trajectories in genetic epilepsies before a genetic diagnosis is made. Clinical information is typically distorted in the EMR in various ways and may not seem useful for predicting genetic diagnosis in the first place. However, the scale of EMR data more than compensates for this inaccuracy. Combinations of various EEG features are predictive of later genetic diagnoses, and genetic epilepsies such as SCN1A-related epilepsies (including Dravet Syndrome) have highly predictive fingerprints months or even years before a diagnosis is confirmed through genetic testing.