Clusters. PCDH19-related epilepsy is recognizable for seizures that arrive in clusters, often with fever, alongside a variable developmental and behavioral phenotype. Its inheritance is unusual: heterozygous females and some mosaic males can be affected, while constitutional hemizygous males usually lack the typical syndrome. A new, large literature study offers something especially useful for phenotype science: an individual-level supplementary table. I used it to ask how PCDH19 looks alongside SCN2A and STXBP1 when all three are translated into the same clinical vocabulary.
The paper. The publication by Grasso and colleagues appeared in Molecular Psychiatry on October 30, 2026. The authors assembled 735 variant-bearing records from 110 publications and analyzed 689 people with the typical PCDH19 phenotype. They catalogued 373 distinct variants, including 195 absent from ClinVar. Earlier seizure onset was associated with greater cognitive and psychiatric burden, whereas broad missense-versus-truncating categories did not provide a simple predictor of severity. This is an observational association, not proof that changing seizure timing changes later outcomes.
The supplement becomes a dataset. I downloaded the PCDH19 supplementary workbook and retrieved the publicly available study data associated with Crawford et al.’s SCN2A analysis and Xian et al.’s STXBP1 analysis. The reusable HPO tables for those two studies are in the Helbig laboratory’s SCN2A and STXBP1 repositories. These are public research datasets; I did not retrieve new patient records.
What I did. I ran an automated extraction, mapping and propagation workflow, with a computational audit of ambiguous mappings. PCDH19 descriptions were translated into Human Phenotype Ontology terms; the existing SCN2A and STXBP1 codes were reconciled to the same HPO release, September 1, 2026. Each positive term was expanded to its ancestors: a focal seizure also supports the broader term seizure. I counted each person once per term, kept explicit negatives separate, and retained source IDs, variant information and mapping provenance. Uncertain EEG descriptions were withheld or mapped conservatively; normal interictal EEG was prevented from creating abnormal EEG ancestors.
Agentic-AI execution. I performed this entire reanalysis using agentic AI, from retrieving the public files and writing extraction and HPO-mapping code to running propagation, auditing outputs, calculating statistics and producing the figures. I did not use a dedicated analysis suite. I wrote and executed general-purpose Python code using libraries for tables, statistics and plotting. The original clinical observations and earlier comparator annotations remain the work of the source investigators; this workflow reused those data under the user’s instructions.
The final cohorts contain 689 PCDH19, 534 STXBP1 and 413 SCN2A individuals. The PCDH19 workbook’s own categories identify the paper’s 46 exclusions. The SCN2A processed cohort has 413 people, despite 417 IDs in its raw file. Across all three cohorts, 10,660 accepted base clinical person–term pairs expand to 43,121 pairs after propagation. These totals include repeated terms across different people; they are not counts of distinct HPO concepts.

Figure 1. Source selection, mapping review and positive-only HPO propagation. The PCDH19 supplement contains 735 variant-bearing records; 46 source-identified exclusions leave 689 individuals in the clinical cohort. STXBP1 contributes 534 individuals. SCN2A uses the published 413-person processed cohort, with the four additional raw-file IDs documented separately. PCDH19 clinical descriptions are mapped to HPO, while the existing STXBP1 and SCN2A codes are reconciled against HPO 2026-09-01. The common review stage preserves source rows, variants, references and mapping provenance, checks ambiguity and positive/negative coexistence, and applies the normal-interictal-EEG guard. Accepted positive clinical terms are deduplicated within each person and propagated through the ontology to their ancestors. The illustrated focal-onset-seizure to seizure relation denotes ancestor support, not a claim that new clinical information was observed. Explicit negatives and unknown or unresolved findings remain separate; absence is never propagated upward, and unreported features are not relabeled absent. A parallel variant audit uses all 735 source records and the stated transcript NM_001184880.2, retaining 666 concordant coding-DNA starts and 661 concordant protein starts and recording all withheld coordinates. Outputs comprise annotation depth, minimum documented frequencies and exploratory Fisher-test/odds-ratio comparisons with Benjamini–Hochberg adjustment. The cohort table counts unique positive person–term pairs: PCDH19 2,930 base and 10,035 propagated; STXBP1 5,169 and 21,951; SCN2A 2,561 and 11,135. Propagated counts include base terms. Related HPO terms overlap and are not independent observations. Vector icons denote source documents, public repositories, term mapping, ontology reconciliation, computational review, evidence polarity, provenance and variant-coordinate checks. The small output-chart icons are schematic, not additional data. This reanalysis was executed through agentic AI using general-purpose Python code and libraries, without a dedicated analysis suite; original clinical assessments and published comparator annotations came from the source investigators. Full resolution.
The variants behind the phenotypes. Before comparing HPO terms, I mapped the source variants along the coding sequence of PCDH19 and the corresponding protein. This overview uses all 735 variant-bearing records; the subsequent phenotype comparisons use the paper’s 689-person clinical cohort. The supplement specifies NM_001184880.2, which I checked against the curated CCDS reference. I could plot 666 concordant coding-DNA starts and 661 concordant amino-acid starts. Several position columns disagree with the written variants; those records remain flagged in the audit. The peaks show how many source individuals share a position, including relatives. They do not establish independent mutational hotspots. I checked coding-DNA and protein coordinates separately. Four records have inconsistent cDNA-position columns, and eight have inconsistent amino-acid-position columns. The exon strip joins coding exons and omits introns: neither that spacing nor an amino-acid position should be read as a genomic coordinate.
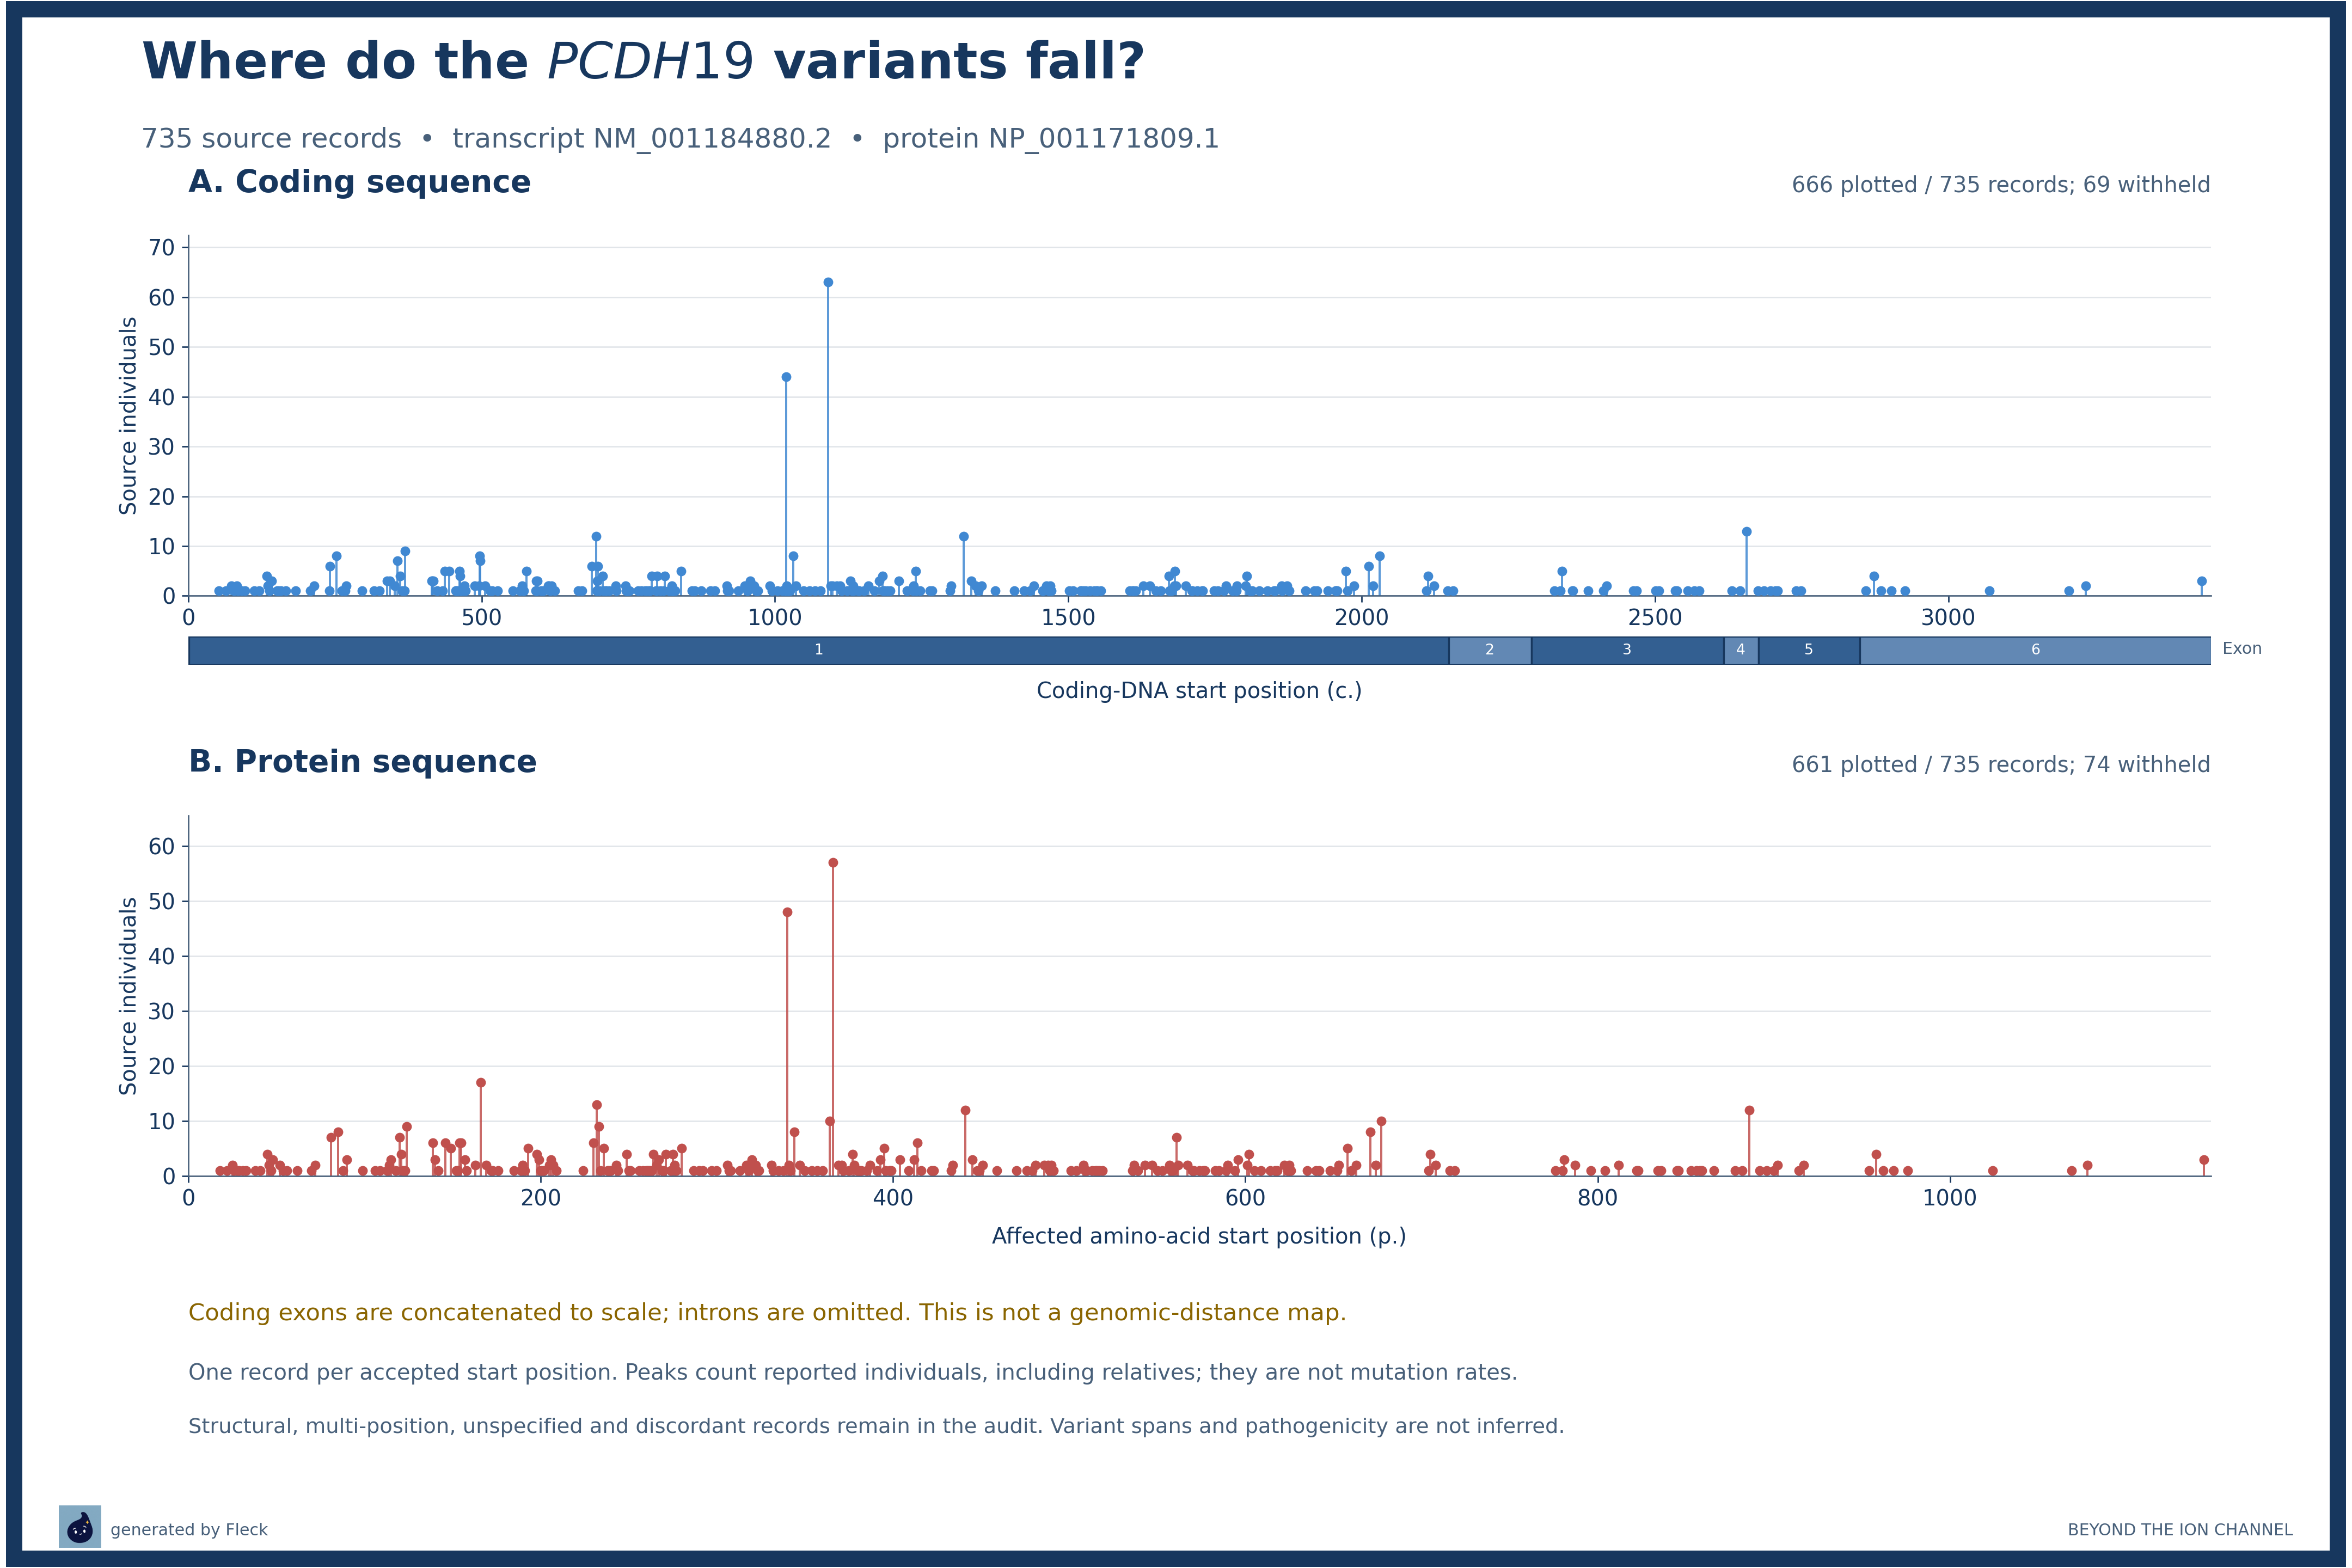
Figure 2. PCDH19 variant-location overview. All 735 variant-bearing source records are considered here, including the 46 excluded from the 689-person clinical HPO cohort. Panel A plots 666 records with a single coding-DNA start coordinate concordant between the written cDNA variant and the CDS-position column; 69 are withheld. Panel B independently plots 661 records whose written protein variant and affected-amino-acid column agree; 74 are withheld. A point represents one start position and height counts source individuals at that position, not unique normalized alleles or independent mutations. Related individuals may share a variant. Intervals use their first position; variant length is not depicted. Structural, complex/multiple, unspecified, out-of-range and discordant records are retained with reasons in the coordinate audit and never assigned invented coordinates. Four records have conflicting written cDNA versus CDS positions; eight have conflicting written protein versus amino-acid positions. No automatic corrections were applied. Coding exons are drawn consecutively to scale from CCDS55462.1, NM_001184880.2 / NP_001171809.1, GRCh38.p14, minus strand; introns and UTRs are omitted. The 3447-nucleotide CDS includes the stop codon and encodes 1148 amino acids. This coding coordinate map is not a genomic-distance map; protein positions are not genomic coordinates. Counts describe literature ascertainment and do not establish hotspots, pathogenicity or genotype-phenotype association. Full resolution.
Depth comes first. Before comparing phenotypes, I looked at how much information each record contains. The median number of base clinical HPO terms is 4 for PCDH19, 9 for STXBP1 and 6 for SCN2A. After propagation, the medians are 14, 38 and 24. Fifty-nine PCDH19 individuals have no accepted clinical annotations under this workflow and remain in the denominator. An empty mapped profile is a gap in the available representation, not an unaffected person. The inset’s information-content summary uses one fixed pooled reference, so the weights are comparable across cohorts; it is not a measure of disease severity. I find five or fewer base terms in 495/689 PCDH19 records, compared with 131/534 STXBP1 and 199/413 SCN2A records. The difference therefore extends beyond the medians. A richly annotated comparator can generate several apparently enriched HPO branches from a more detailed description of the same clinical domain.
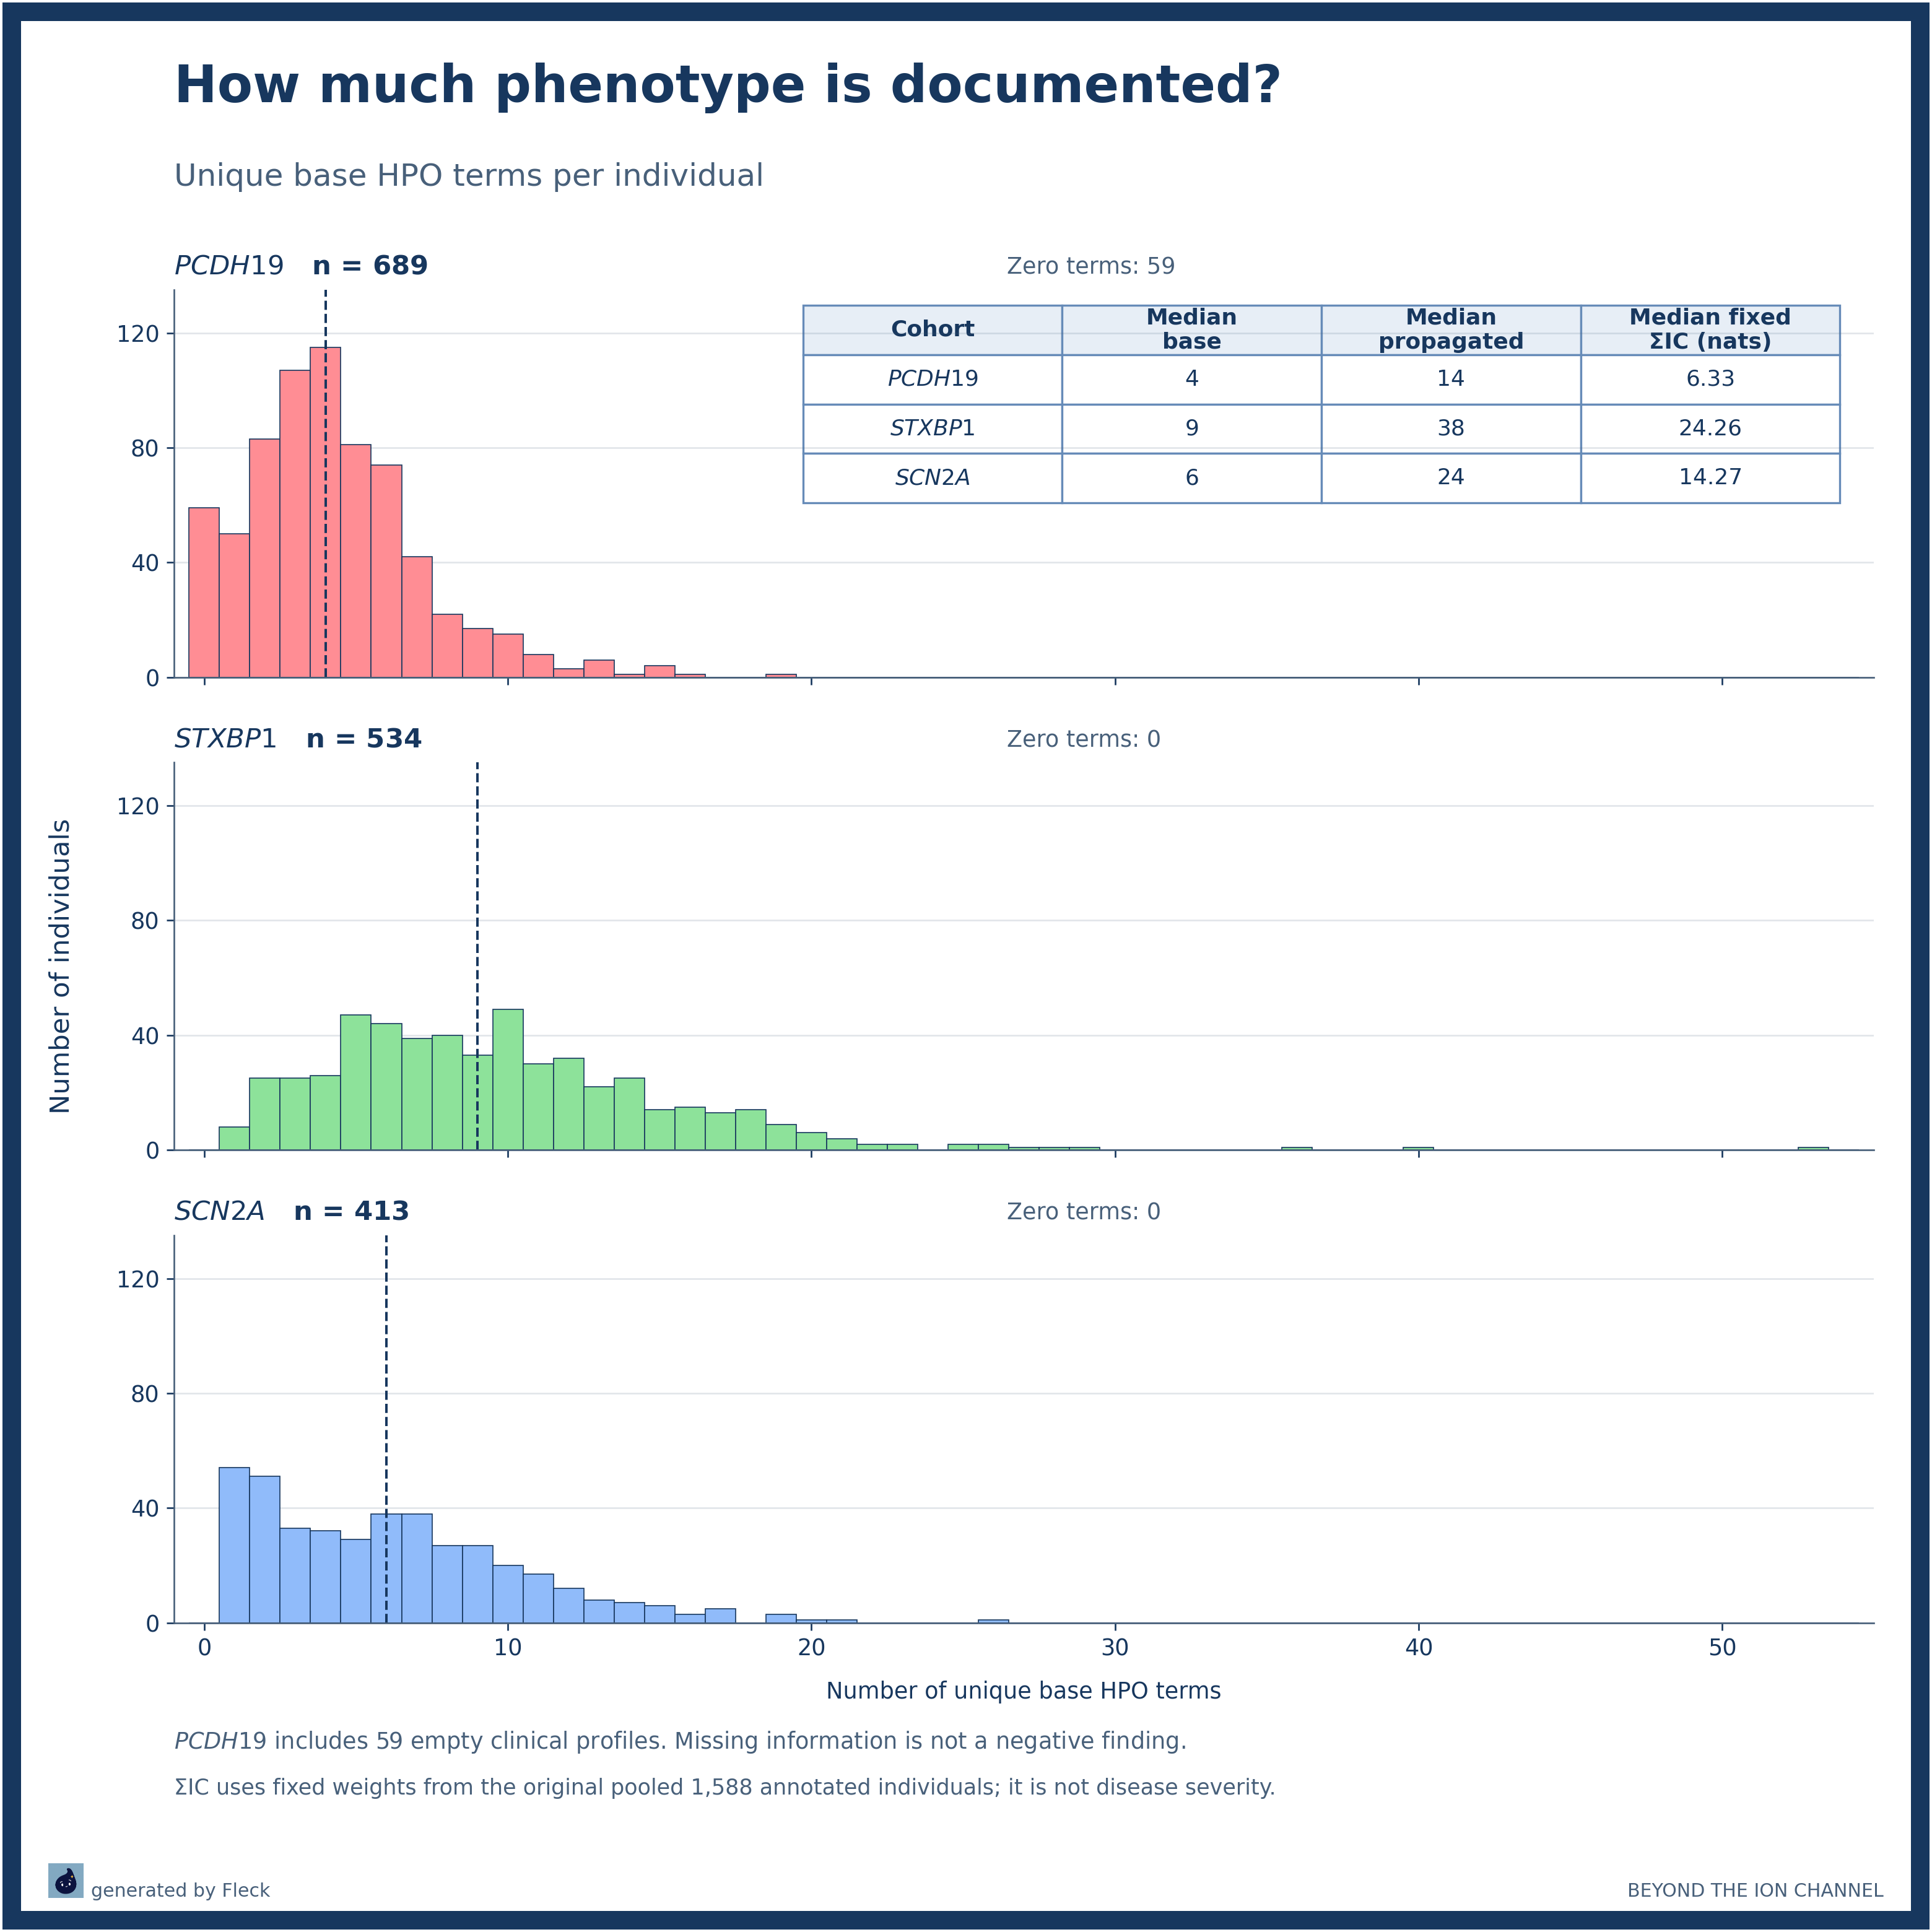
Figure 3. The depth of the record differs across cohorts. Histograms show the number of unique accepted positive base clinical HPO terms per individual, with one-integer bins, shared axes, and dashed cohort medians. All 689 PCDH19, 534 STXBP1 and 413 SCN2A source individuals are included, including 59 PCDH19 individuals with no accepted clinical terms. Median base/propagated counts are 4/14, 9/38 and 6/24, respectively. Propagated counts include base terms and their clinical ancestors under HPO 2026-09-01, excluding roots, modifiers and normal observations. The inset’s profile sum IC is the sum of -ln(n_t/1588) over unique base terms; n_t is the number with that propagated term in the fixed original pooled corpus of 1,588 annotated individuals, before selection of the 689-person PCDH19 subset. These fixed weights preserve comparability to the audited earlier computation. Empty profiles have sum IC zero. The corresponding cohort medians are 6.33, 24.26 and 14.27 nats. Sum IC is not joint entropy, and annotation depth is not disease severity. Generated by Fleck for Beyond the Ion Channel. Full resolution.
The frequency landscape. The four familiar views—seizures, EEG, movement, and other neurological features—make the differences tangible. Seizure documentation is common in all three cohorts: 562/689 PCDH19, 475/534 STXBP1 and 342/413 SCN2A. PCDH19 has prominent focal-seizure and seizure-cluster documentation, with intellectual disability recorded in 320 people and autistic behavior in 181. STXBP1 has much more extensive movement and tone documentation, including hypotonia in 216/534 people; SCN2A includes hypotonia in 98/413. The very sparse PCDH19 movement panel is a reason to inspect how the original table was constructed, not evidence that these features never occur. EEG documentation adds another contrast: 193/689 PCDH19, 377/534 STXBP1 and 206/413 SCN2A records support an EEG abnormality. I would inspect assessment coverage and the original wording before treating the more specific electrophysiological differences as differences in disease biology.
The bars show minimum documented frequencies using the entire included cohort. That differs from a paper’s frequency among people assessed for a feature. For example, the PCDH19 study reports seizure clusters in 431/445 people with relevant information; my plot retains the same 431 documented positives but uses all 689 included individuals. Neither denominator should be silently substituted for the other. The same numerator gives 96.9% among those with relevant information and 62.6% across the clinical cohort. I use the latter denominator consistently to show minimum documented frequency.

Figure 4. Three cohorts, four views of the neurological phenotype. Columns show PCDH19 (689), STXBP1 (534) and SCN2A (413). Rows show seizures (purple), EEG abnormalities (green), movement disorders (yellow), and other neurological disorders (blue). Each bar counts unique individuals with direct or propagated positive support for the term; source-cohort denominators are shown above each column. Up to eight terms per category are displayed, ranked by count descending, then label and HPO ID. All terms are supplied in the frequency table. Category precedence is seizure descendants of HP:0001250 plus seizure-cluster modifier HP:0033349; EEG descendants of HP:0002353 excluding normal interictal EEG; movement, tone and coordination descendants of HP:0100022, HP:0003808 or HP:0011443; then remaining nervous-system descendants of HP:0000707. Category assignment is exclusive for terms, not for individuals, and related ancestor bars must not be summed. The cluster modifier is shown explicitly here but excluded from the clinical depth metrics. Negative findings remain separate, and missing findings are unknown. Frequencies are minimum documented proportions rather than assessed-person prevalence. HPO 2026-09-01 and the normal-interictal-EEG safeguard are used throughout. Generated by Fleck for Beyond the Ion Channel. Full resolution.
The volcano plots. I then compared STXBP1 with PCDH19 and SCN2A with PCDH19. Each point represents one propagated clinical term. Rightward points indicate more positive documentation in the comparator; leftward points indicate more in PCDH19. Height represents the strength of the two-sided Fisher test. Colors reflect Benjamini–Hochberg adjustment across 673 eligible tests, and the tables give the actual counts, percentages, HPO IDs, p values and odds ratios. The ten lowest p values in each direction are labeled, with ties resolved by HPO ID. The approach follows the Fisher-test and odds-ratio structure of the published BSN volcano workflow, with explicit multiple-testing correction and zero-cell handling. Fisher’s comparison uses documented positive versus not documented positive, which includes unknowns. I retain explicit negatives separately in the audit. For empty cells, adding 0.5 only makes the plotted coordinate finite; the test and raw odds ratio use original counts.
The STXBP1 comparison emphasizes recorded motor, tone and spasm features; the SCN2A comparison emphasizes encephalopathy and related documentation. PCDH19 has comparatively more documentation of mild intellectual disability, bilateral tonic-clonic seizures and selected behavioral features. These are useful prompts for clinical review. They are not independent discoveries: a single observation can support several related HPO ancestors. Status epilepticus is documented in 87/689 PCDH19 records, versus 14/534 STXBP1 and 19/413 SCN2A records. Yet the broad seizure term barely separates SCN2A from PCDH19: odds ratio 1.09, adjusted q=0.66. Shared epilepsy coexists with different documented seizure profiles.
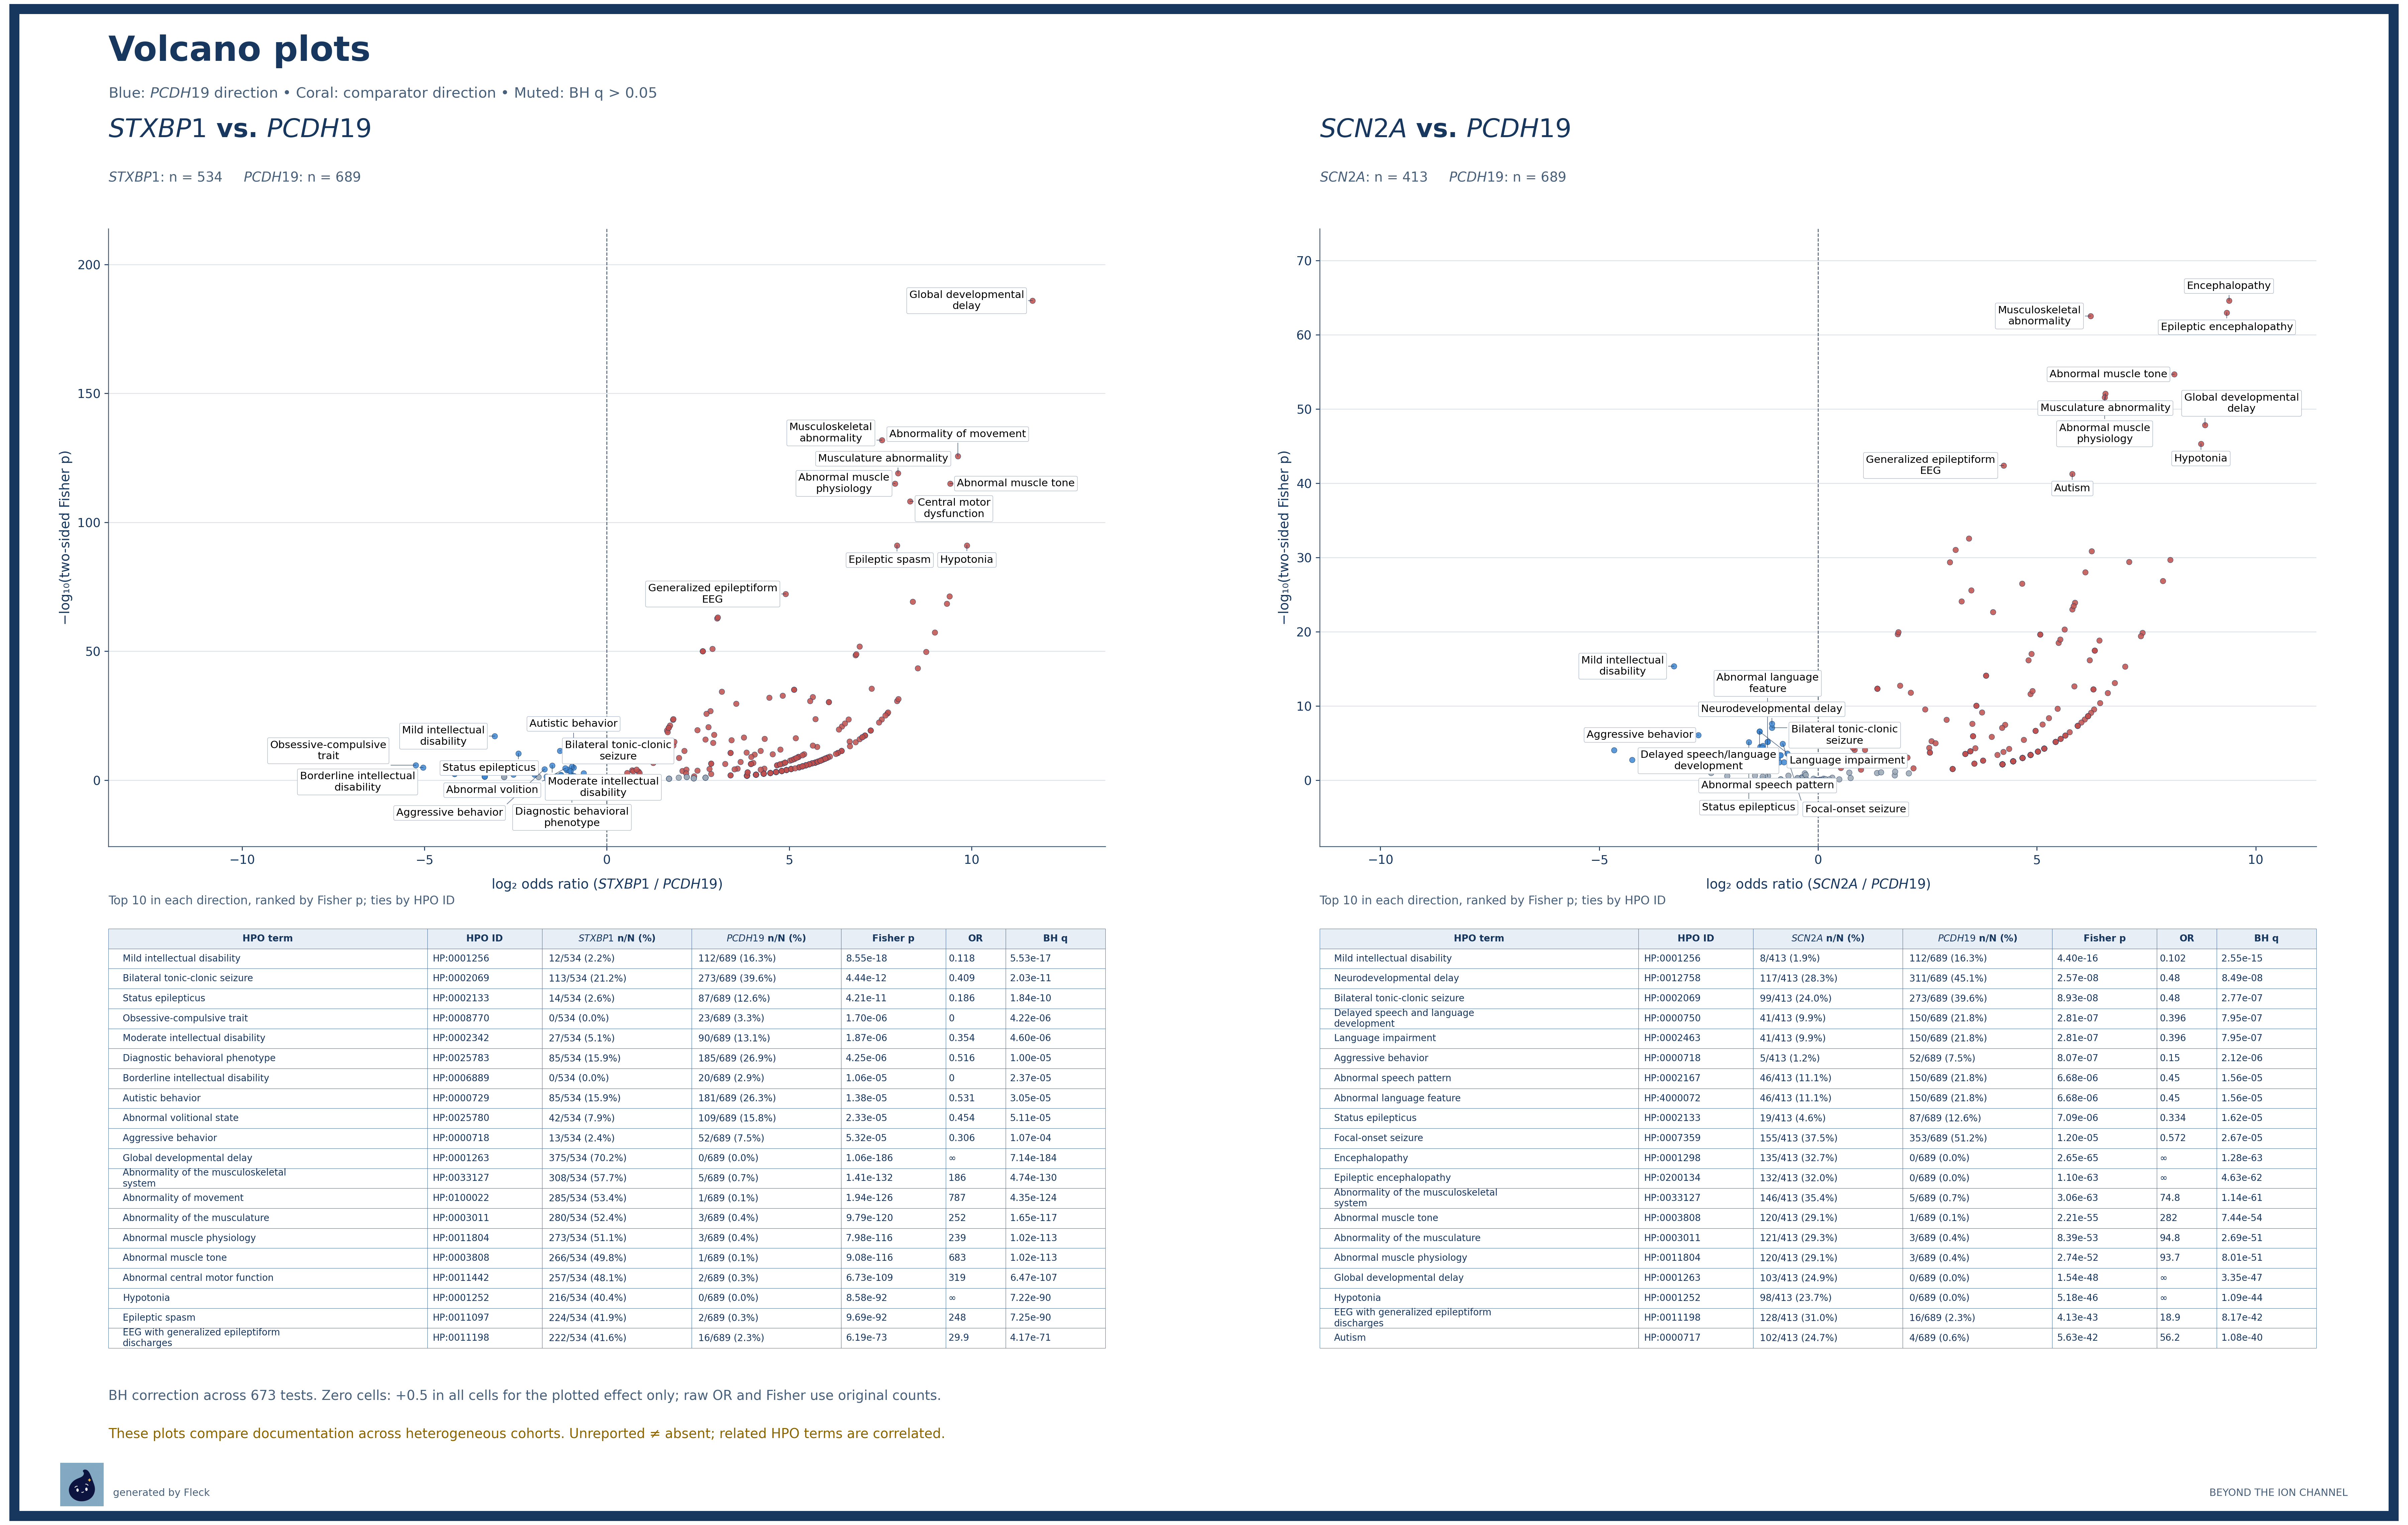
Figure 5. A statistical view of phenotype documentation. The left panel compares STXBP1 (534 individuals) with PCDH19 (689); the right compares SCN2A (413) with PCDH19 (689). Each point is a propagated clinical HPO term. The x-axis is log2 odds ratio of positive documentation in the comparator divided by PCDH19; leftward points favor PCDH19, rightward points favor the comparator. The y-axis is -log10 of the two-sided Fisher exact p value. Terms enter testing when pooled positive and not-documented-positive counts are each at least five, giving 406 STXBP1 and 267 SCN2A tests. Blue/coral points meet joint Benjamini–Hochberg q<=0.05 across all 673 tests; muted points do not. The ten smallest Fisher p values in each direction are labeled without significance filtering or ancestor pruning; ties use HPO ID. Labels are black in rounded white boxes, with short connectors where necessary. Tables contain full HPO IDs, positive n/N and percentages, raw Fisher p, uncorrected odds ratios, and BH q. With any zero cell, 0.5 is added to all four cells only to display a finite log2 OR; exact tests and table OR use original counts, so infinity may appear. The complement of positive documentation contains both explicit negatives and unknowns, separately tabulated in the underlying data. HPO terms are dependent, some individuals are related, and cohort ascertainment and coding differ. These are exploratory documentation comparisons, not evidence of unbiased biological enrichment. Zero mapped global developmental delay in PCDH19 is a coding gap, not demonstrated absence. Generated by Fleck for Beyond the Ion Channel. Full resolution.
The biggest point needs the closest look. Global developmental delay is recorded explicitly in 375/534 STXBP1 and 103/413 SCN2A individuals, but has no direct or inherited support in the accepted PCDH19 mapping. That produces a dramatic contrast. Yet 311 PCDH19 individuals map to the broader term neurodevelopmental delay. The volcano is exposing a difference in coding and source detail, not establishing that PCDH19 spares development. Likewise, the specific terms autism and autistic behavior cannot be treated as interchangeable. A shared ontology aligns the vocabulary; it does not make the original assessments equivalent. I find four PCDH19 records mapped to autism but 181 mapped to autistic behavior; SCN2A has 102 and 108, respectively. These concepts can overlap within individuals. Combining their counts without reviewing the records would change the question and could count people twice.
Where PCDH19 stands out. I find a useful distinction between broad intellectual-disability documentation and its recorded severity. The broad term occurs in 320/689 PCDH19 records (46.4%), 247/534 STXBP1 records (46.3%) and 188/413 SCN2A records (45.5%), yet mild intellectual disability is recorded in 112/689 (16.3%), 12/534 (2.2%) and 8/413 (1.9%), respectively. Alongside seizure clustering, focal seizures and behavioral findings, this gives PCDH19 a distinctive documented profile without establishing a globally milder disorder. It is compatible with the variable cognitive outcomes described in Grasso et al.’s publication. However, I have not stratified these comparisons by seizure-onset age or variant class, so they do not retest the authors’ association between earlier onset and greater cognitive or psychiatric burden, or their lack of an overall missense-versus-truncating difference. The Helbig team’s earlier HPO work provides an instructive comparison: Crawford et al.’s SCN2A study associated variant classes with different seizure and behavioral profiles, while Xian et al.’s STXBP1 study emphasized broad neurodevelopmental involvement and age-dependent phenotype documentation. I therefore read the present contrasts as specific phenotype patterns that need age and ascertainment context. Because I reuse those public cohorts, agreement with their earlier analyses is not independent replication.
What this tells me. Public supplements can become a reusable, auditable phenotype resource. I can recover recognizable clinical patterns, identify where records are thin, and point reviewers to the source descriptions behind a statistical result. The next useful step is targeted clinical re-review of the strongest contrasts, with comparable ascertainment, age and assessment denominators. Automated propagation makes those questions easier to ask. It cannot answer missing clinical questions on its own. I would prioritize developmental terminology, movement findings and EEG descriptions for review. These recurring contrasts point to specific questions: which features were assessed, how they were described, and whether equivalent observations were coded at comparable specificity. I would then rerun the same comparisons after harmonizing those descriptions, retaining an audit of every change.
Audit and reuse. The linked materials contain the cohort-selection audit, patient-level and term-level data, source provenance, pinned ontology, reproducible analysis and figure code, and detailed methods. Full figure legends appear beneath each figure and are retained in the image metadata. The datasets differ in age, recruitment, coding and completeness; relatives and overlapping literature sources can also limit independence. The comparisons describe the available documentation and should be interpreted accordingly.
Cohort selection audit.
Full data, analysis code and figure code.
Detailed methods.
Full figure legends.